A 3D pole-to-pole oscillation model of MinD on
Escherichia coli membrane
Satya Nanda Vel Arjunan and Masaru Tomita
Institute for Advanced Biosciences, Keio University, Japan
Introduction
In Escherichia coli, nucleoid occlusion and the dynamic localization of Min system of proteins, MinC, MinD and MinE, restrict FtsZ polymerization (Z-ring) to the midcell. Accurate assembly of Z-ring, which is believed to function as a scaffold for the formation of the cytokinetic ring, is crucial for the equal distribution of cytoplasmic and genetic materials between daughter cells. MinC destabilizes the Z-ring assembly by inhibiting FtsZ polymerization. MinD, a peripheral membrane ATPase, recruits MinC to the membrane and polymerizes. MinE ensures the time-averaged concentration of MinCD complex on the membrane is low at the midcell and higher elsewhere by inducing MinCD to depolymerize and oscillate between the cell poles. As a result, the Z-ring can only assemble at the midcell [1].
We present a fast Monte Carlo spatio-temporal algorithm which successfully reproduces wild-type phenotypes of the Min system. Effects of molecular crowding [2] on the membrane and more importantly, in the cytoplasm, is accounted for by explicitly executing stochastic reaction and diffusion of each molecule in a time-step. Unlike other documented models, it is able generate the MinD spiral assembly [3] on the cell membrane. Fast simulation is made possible through its multi-threaded implementation that fully utilizes shared-memory multiprocessing resources, including those of multi-core processor systems.
Methods
Simulation Algorithm
We describe the proposed simulation algorithm in this section. When simulating molecules in the cell, at every time step, each molecule is diffused using a mean square displacement computed from its diffusion coefficient. A molecule only successfully diffuses if there are no other molecules blocking its way. A collision is said to have occurred if a molecule is blocked by another molecule during diffusion. Collision between reacting species can lead to reaction.
Checking for collision for every molecule at every time step is the biggest contributor to the computational time. In a brute-force method, each molecule is evaluated for collision with every other molecule when it diffuses. To alleviate such computational complexity, we discretized the three-dimensional simulation space into uniformly-sized spheres and only check for collision at the destination sphere. The spheres are arranged tightly into cubic-close packing that results in 74% of volume occupancy (Figure 1).
Because a sphere can only occupy a single molecule, the radius of the sphere is selected following the hydrodynamic radius of the largest diffusing molecule, which can also be a molecule complex. A molecule can only diffuse from the originating sphere to one of its 12 neighboring spheres that is chosen randomly (Figure 2). When the destination sphere is occupied by a reactant pair, a second order reaction takes place if the reaction probability for the collision is met (Figure 3). Similarly, when a molecule complex dissociates following its dissociation probability, it needs to find a vacant neighbor sphere randomly to place the dissociated molecule (Figure 4).
Shared-Memory Multiprocessing
The simulation algorithm has been extended to run on shared-memory multiprocessing systems using multiple threads. A straight forward approach to parallelizing discrete-space simulation algorithms is to partition the lattice of spheres into equal volumes and assign the partitions to different processors (using threads). An example of a lattice with three partitions for three processors is shown in Figure 5. The processors need to synchronize when the molecules diffuse from one partition to another. In our approach, we created shared regions within the partitions that will be used by two processors to permit synchronization. In Figure 5 regions b and c are shared by processor 0 and 1, while regions e and f are shared by processor 1 and 2.
The molecules are placed at random locations within the lattice during initialization. During the placement, the molecules are classified into the regions in which they are placed. At each time step, a processor executes reaction and diffusion of molecules within each region of its partition sequentially. For example, processor 0 executes the molecules within region a before proceeding to region b. However, the processor needs to ensure that when it is executing the molecules within a shared region, another processor is not executing the molecules within its adjacent region. In this case, processor 0 must only execute within region b when processor 1 is not executing region c. This can be implemented by creating busy flags for each shared region and checking the flags of the adjacent shared region before executing a shared region.
To effectively visualize the simulation, we developed a standalone graphical interface using the OpenGL library. The interface permits visualization of species of interest at any time during the simulation. This feature is crucial when we want to see the molecules in a specific compartment such as the membrane.
Figure 1: Cubic-close Packing
Figure 2: Diffusion of a molecule to one of its 12 neighboring spheres
Figure 3: Second-order reaction
Figure 4: First-order reaction
Figure 5: Partitioning of lattice into regions for shared-memory multiprocessing
P0, P1 and P2 are the three partitions of the lattice assigned to processor 0, 1 and 2 respectively. a, b .. g are the regions within the partitions which are executed sequentially by the processor. For example, processor 0 must complete executing diffusion and reaction of molecules within the region a before executing within region b. x is the radius of the largest diffusing molecule in the lattice. y is obtained by dividing the length of the lattice, z by the number of processors.
MinCDE model
In this section we present the MinCDE model that we used to validate our simulation algorithm. Initially, to ensure that our algorithm is accurate, we implemented the model as described by [4] and [5], shown in Figure 6. The parameters that we used are listed in Table 1. In a volume of 2.88 femtoliter, i.e., the estimated volume of E.coli, discretized into spheres of radius 0.05 μm, we initialized the cell cytoplasm with 2160 MinD_ATP molecules, 1080 MinE molecules and 2160 MinD_ADP molecules. In addition, we extended the model to include the formation of MinD spiral polymers on the membrane. The corresponding parameters for the MinD spiral forming model is listed in Table 2.
Figure 6: The MinCDE model
|
p |
Reaction |
Reaction probability (Δt=0.2 us) |
|
p1 |
MinD_ADP -> MinD_ATP |
0.00717 |
|
p2 |
MinD_ATP + m -> MinD_ATP_m |
0.00068 |
|
p3 |
MinD_ATP + MinD_ATP_m -> 2MinD_ATP_m |
0.06607 |
|
p4 |
MinE + MinD_ATP_m -> MinD_ATP_m_MinE |
1.0 |
|
p5 |
MinD_ATP_m_MinE -> MinD_ADP_m + MinE |
0.000502 |
|
p6 |
MinD_ADP_m -> MinD_ADP |
1.0 |
Table 1: Parameters of MinCDE model
|
p |
Reaction |
Reaction probability (Δt=0.2 us) |
|
p7 |
MinD_ATP_m + MinD_ATP -> 2MinD_ATP_m_headDimer |
0.00068 |
|
p8 |
MinD_ATP_m_headDimer + MinD_ATP -> MinD_ATP_m_bodyDimer + MinD_ATP_m_headDimer |
0.00068 |
|
p9 |
MinD_ATP_m_bodyDimer + MinD_ATP -> MinD_ATP_m_tailTetramer + MinD_ATP_m_headDimer |
0.00068 |
|
p10 |
MinD_ATP_m + MinD_ATP_m -> 2MinD_ATP_m_headDimer |
0.00068 |
|
p11 |
MinD_ATP_m_headDimer + MinD_ATP_m -> MinD_ATP_m_bodyDimer + MinD_ATP_m_headDimer |
0.00068 |
|
p12 |
MinD_ATP_m_bodyDimer + MinD_ATP_m -> MinD_ATP_m_tailTetramer + MinD_ATP_m_headDimer |
0.00068 |
Table 2: Parameters of MinD spiral polymerizing model
Results and Discussion
Using the parameters in Table 1, our model was able to reproduce the pole-to-pole oscillation of MinD molecules on the cell membrane. Furthermore, even when the molecules were initialized randomly at different locations in the cytoplasm, the oscillation was spontaneously formed after an interval of 1 minute in all of 20 trial runs. The period of oscillation is averaged at 45 s, which is within the range of wildtype oscillation period (Figure 7).
Our model was also able reproduce MinD spiral polymerization on the membrane, shown in Figure 8. However, we have not been able to successfully reproduce the oscillation when such polymerization takes place. This is because it is difficult to predict the reaction parameters. We are currently obtaining quantitative data of MinD polymerization and depolymerization from the literature for this purpose.
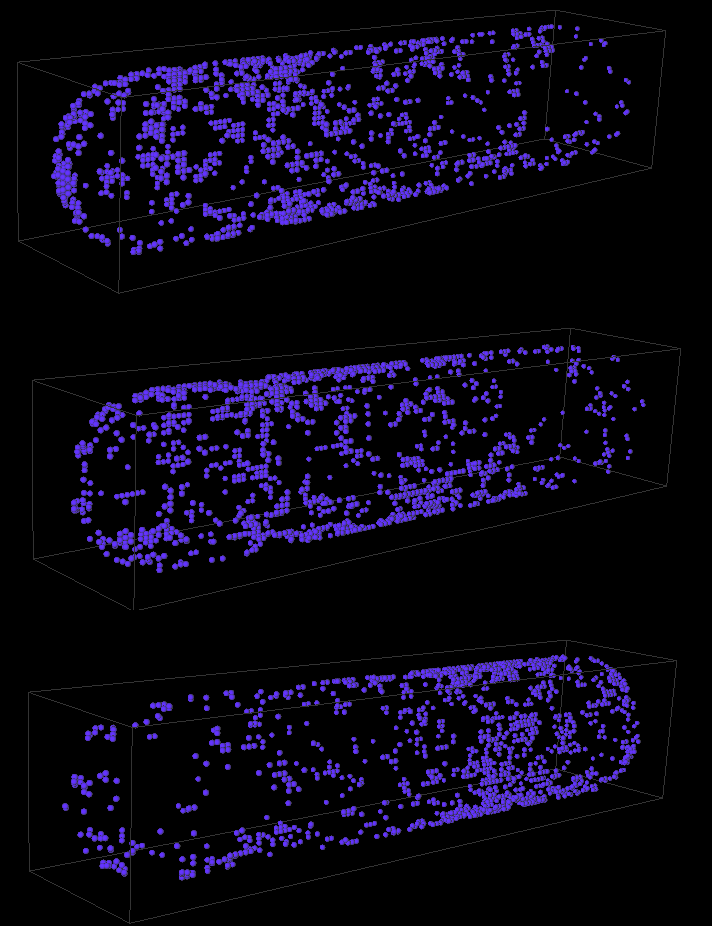


Figure 7: MinD oscillation on Escherichia coli membrane
Figure 8: MinD polymerization on Escherichia coli membrane
References
Rothfield, L., Taghbalout, A. & Shih, Y. L. Spatial control of bacterial division-site placement. Nat. Rev. Microbiol. 12, 959–68 (2005).
Takahashi, K., Arjunan S. N. V. & Tomita, M. Space in systems biology of signaling pathways – towards intracellular molecular crowding in silico. FEBS Lett. 579, 1783–1788 (2005).
Shih, Y-L., Le, T. & Rothfield, L. Division site selection in Escherichia coli involves dynamic redistribution of Min proteins within coiled structures that extend between the two cell poles. Proc. Natl. Acad. Sci. USA 100, 7865–7870 (2003).
Kerr, R., Levine, H., Sejnowski, T. J & Rappel, W-J. Division accuracy in a stochastic model of Min oscillations in Escherichia coli. Proc. Natl. Acad. Sci. USA 103, 347-352 (2006).
Fange, D. & Elf, J. Noise-induced Min phenotypes in Escherichia coli. PLoS Comput. Biol. 2(6): e80 (2006).