Taikichiro Mori Memorial Research Grants
Graduate Student Researcher Development Grant Report
February 2016
Research project : Capture existing architectural environments in semantic enriched 3D format
Researcher : Joaquim Silvestre
E-mail : joaquim.silvestre@keio.jp
Architects design projects based upon documents that measure the site or existing building in order to make a proposition that fit to the specificity of the context. That's especially true when the project is about modification of existing buildings. Those documents can be plans, section, photography but the most convenient is to get 3D volumes present in the surroundings.
Progress has been made on the system to capture 3D volume but the raw 3D data produced through these systems consist of a whole indistinct mesh without any semantic information embedded in. Compared to a B.I.M. (Building Information Model), a data format rich of semantic information, these meshes are complicated to edit. The purpose of this research is to find an automated system to transform raw 3D data of capture in a more refined type of 3D model format convenient for designers.
To succeed this refinement of data, data is progressively understood by the system into low-level information of separated 2D segments until getting abstract formalisation of the data that fit to designer's way to think architecture through is digital tools.
General principle
Separate object of each other is very natural for humans but
creating an algorithm that performs the same function need that we
rediscover how we process to see.First of all, we need to redefine what is an object in order to detect it correctly. Imagine that we can only see a 2D shape on a background. The continuity of the object is the first clue but it's not enough. On manufactured objects we can see discontinuity in colours and materials. Joint between parts are very usual so this sole rule is not enough. The continuity space should be respected − i.e. pixels considered to belong to the same object should be next to each other. On usual picture data we can easily detect this continuity but continuity of material can happen while pixels of the same material belong to distant objects on the depth axis. On the other hand, discontinuity, clue of different objects, can be misleading since the object gather different textures and materials. So, proximity in the X,Y plan and in the Z plan can be the clue of X, Y pixels belonging to the same objects. Nonetheless, even by checking continuity of material or geometric continuity, discontinuities in space can happen on elongated objects. So any conclusion can't be made on a sole picture and a consensus need to be done amongst various pictures of the same set of objects. Beside that, recognition of an object can't be done only geometrically, object next to each other can't be guessed as separated object unless one is displaced. The true nature of an object is that it's an implacable unit and it can be checked only by grasping it. What help us, human, to check if something is an object is our experience and the notion of similarity. This "educational factor" can be emulated through Convolutional Neural network (ConvNet).
By training the ConvNet system to recognise and segment object in pictures, known objects can be correctly segmented. Even objects that only look like object pictures used for the training can be detected. The association of those 3 clues can provide a correct multi-segmentation that keep coherence between the various samples.
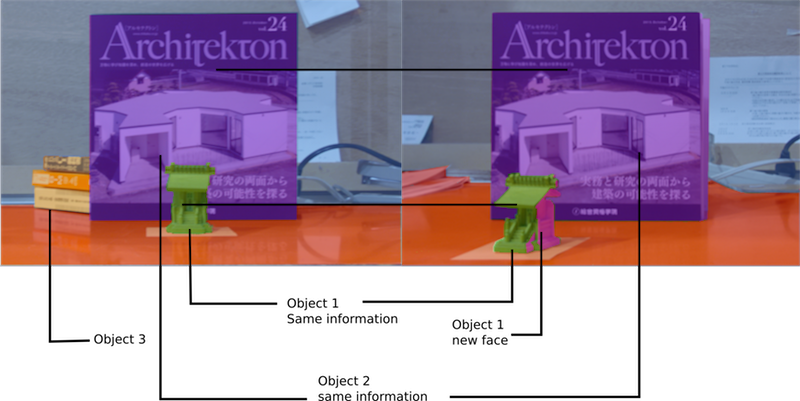
Figure 1 : Scene segementation
Technical process
The first step in the process of image analysis is a general
segmentation using SLIC algorithm. SLIC is the acronym for Superpixel
Linear Spectral Clustering, it segments images into super pixels
according to perceptual meaningfulness. This perceptual meaningfulness
is limited on colour information of the pictures. With the Lytro
camera, depth information can be retrieved from light field data
format. With this data, a new parameters can help to segment more
precisely what is the object. Then the third system comes to confirm by
using ConvNet trained on the largest set of object possible. For this
research, the set of objects have been limited to 20 to test the
general principle.Measuring the objects parameters
Once objects are isolated from each other in each scene, the object need to be decomposed in components that can be produced by 3D modelling CAD command. The problem is a bit similar to the previous one: differentiation of gathered elements. But on this step, the criterium change, our experience of what is an object doesn't need to be emulated, the modelling experience or how to build it needs to be guess. For a given shape, there is a various assembly process possibility. This assembly process is, in modelling software terms, a series of commands. The order and type of command can vary to achieve the same goal. The goal of this step is to find the proper series of commands and parameters to build a digital model of each scanned object in the scene. To perform this we need to conjugate geometric technique and machine learning.From the strip of scattered depth map, we can extract strategic measurement : points, lines, curves and surfaces. Some of these measurements can help to deduce other plausible measurements. Line Intersection creates point, surface intersection create lines, from surface normal curve can be extracted too.
Line, points, curves and surfaces are the very basic component that allows to create any shape in Rhino 3D modelling software. This informations are not directly accessible in the scattered depth map but can be detected by computer vision. Analysis of the variation of grey can indicate the normal of a surface. For example : parallel normals indicate flat surfaces, manifest modification of the normal directions are clues of an edge.
Once actual feature measurement and deduced measurement are extracted, they are stored in the vectorial database. This one record measurements and their positions in the strip of scattered depth map. According to the position in the strip, we can retrieve the position of the camera. From the camera position, we can reproject le measurement in 3D space with epipolar geometry. Interactions measurements are stored in the same 3D space but on a different layer. Then with this list of measurement stored in 3D space and on the strip, the next step can start.
A Recursive Neural Network RNN system tries to detect possible form in the depth-map strip. Features are stored in a long-term short term memory then when it matches with another feature it detects a possible shape. Strips of depth-map can be imagined liked a text that we try to analyse. The sequential aspect of the strip makes necessary to callback some features of the beginning of the strip in order to get the context of another one.
A problem of neural network in general is their black box aspect. It's hard to trace back which group of features triggers the detection of a shape. Suppose that you want to know which features triggers the box or sphere answer. You can't know if the features that you usually recognise in a box will be the features that triggers the neural network answer. And above that, if you want to know what is the measurement of that box: which points, which edge, and their corresponding measurements, belongs to that detected box.
So the RNN need to keep track of the elements to decipher geometric meaning of the depth-map strip and retrieve measurement for the building phase.
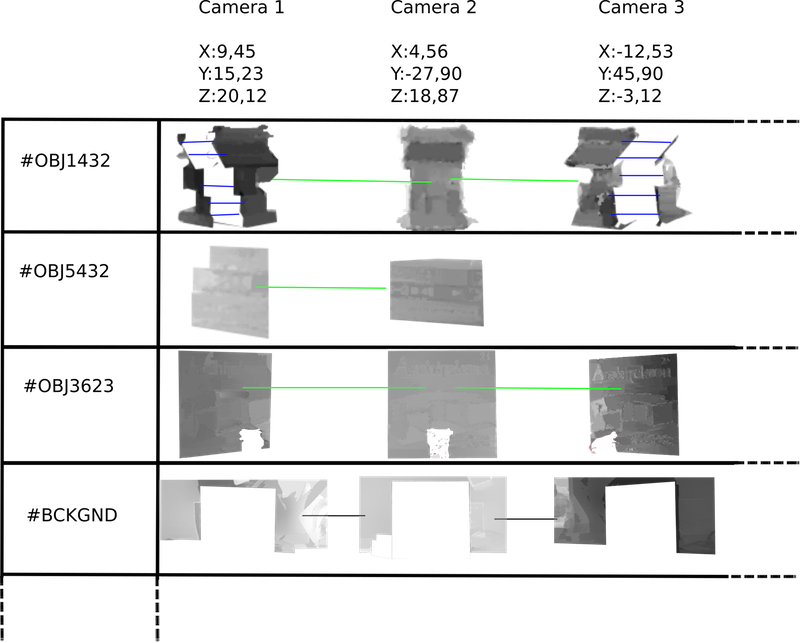
Figure 2 : Data Base of objects depth-map
The RNN sparse the strip with various size and shape of windows
in order to discover various types of features. The features detected
are mapped on the strip and can be imagined as a letter in text. Their
association produce words then from word meaning appears in a sentence.
As text analysis, some words said at the beginning of the strip may
completely change the meaning of a group of 3 words at the end of the
sentence.Those basic words are like: planar surface, point, edge, curvature.
To get the corresponding depth-map of each pictures automatically we used the Illum Lytro Camera. This light field camera automatically detects the angles of the rays of light touching the lens. By this way, each colour pixel can be mapped to a depth value. The depth values are represented in levels of grey: closer are whiter and far from the lens are darker. A maybe easier way to visualise is to use heat map like in the right image of the figure 3. The heath map is used here to differentiate previously known data from the previous parsed image and new depth data encounter in these pictures that are still represented in grey. Frame of the pictures helps to keep track of the position of the elements in the pictures composition from which it has been extracted.
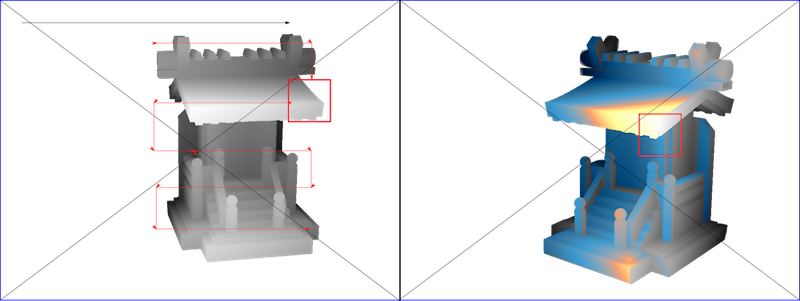
Figure 3 : Parsing windows
Techincal process
Once images are segmented into scattered images of different points of
view, the depth map that corresponds of each segment is stored in the
data base. Like in the figure 2, each segment of a piece of depth maps
are stored by objects and cameras. All the segments of one object are
concatenated in order to become a very long image.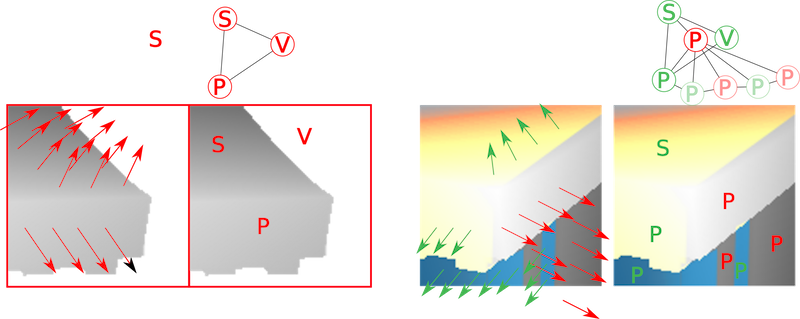
Figure 4 : features remaped on the depthmap strip
Reconstruction
Then to construct this shape, there are various recipes. The point is to make them match with avaible measurement in the vectorial database.In the ends, it proposes various arrangements sorted by a range of probability. The user selects the assembly process the most interessant for the use he wants to make.
To store this possibility of reconstruction, an adjancy graph is generated from the scanned letters. From this adjancy graph various proprieties of the shapes can be detected.:Parrallel surfaces, revolution shape, convexity.
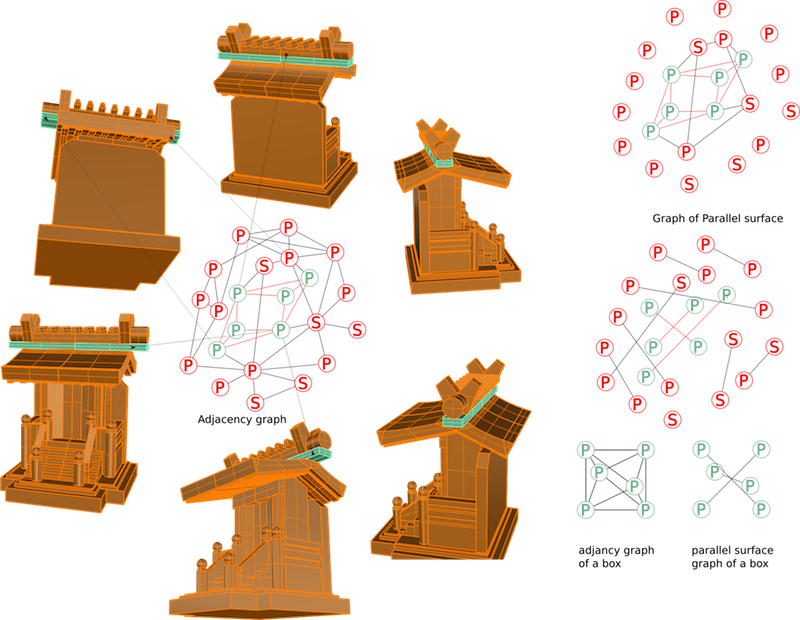
Figure 5 : Parital agency graph extracted from the model.
Finally, I would like to take this opportunity to express my sincere gratitude to Mori Fund Committee for selecting my project.